%201-1.webp?width=148&height=74&name=our%20work%20(2)%201-1.webp)


Monitor how users interact with your web content, including pages and blogs. Evaluate the performance of smart content and videos. Updates occur every 20-30 minutes.
For overall insights on a domain, head to the marketing reports on your dashboard. Custom reports are doable with Marketing Hub Pro & Enterprise and CMS Hub Pro & Enterprise in the analytics tool.
Assess Specific Content: Check page or blog performance by following these steps
- Navigate to the content
- Website Pages: HubSpot account > Marketing > Website > Website Pages.
- Landing Pages: HubSpot account > Marketing > Landing Pages.
- Blog: HubSpot account > Marketing > Website > Blog.
- Click the content name.
- To focus on specific timeframes, use the Date range dropdown.
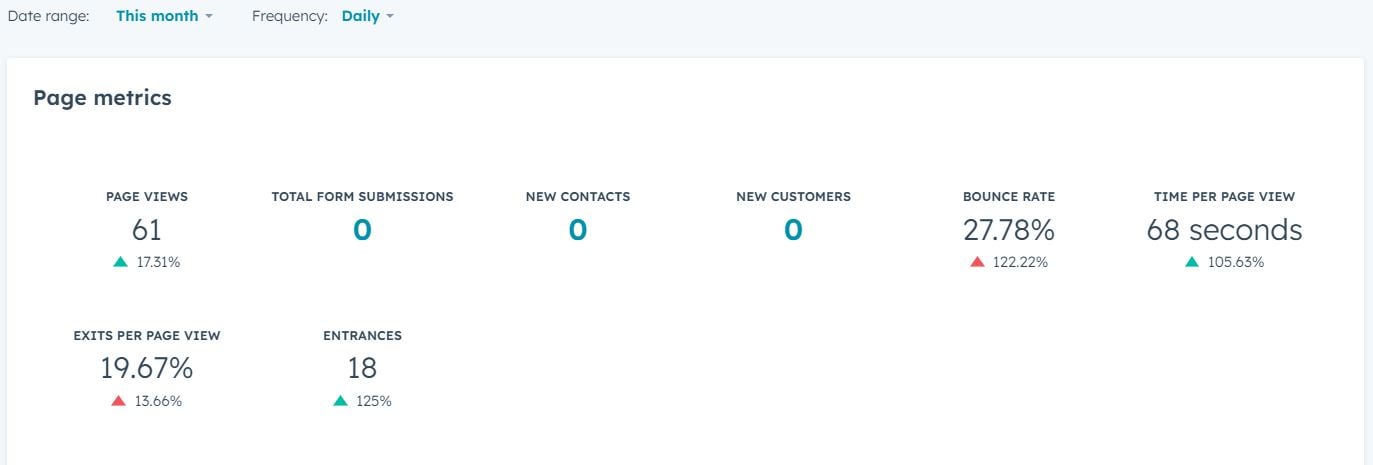
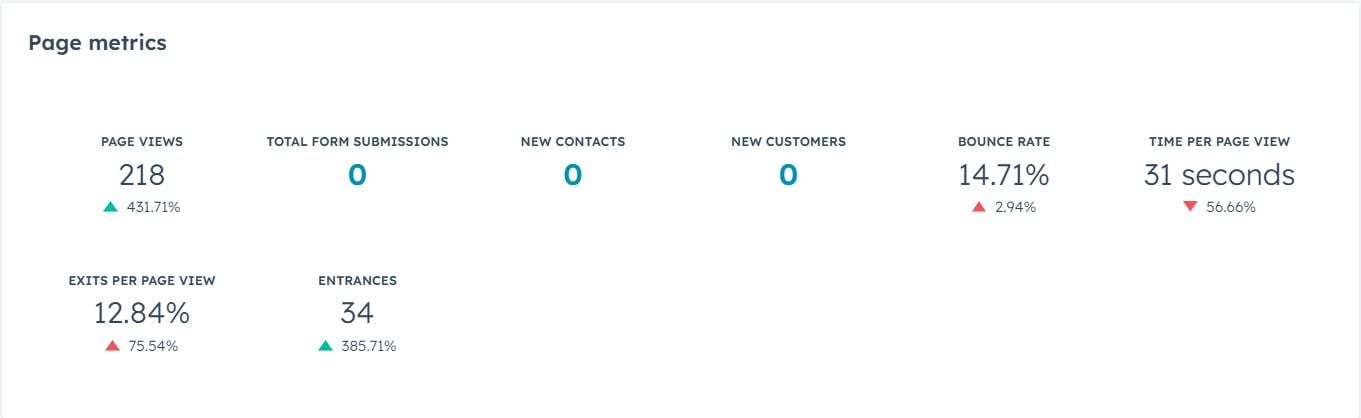
Performance
The Performance tab reveals vital content insights. Marketing Hub Enterprise accounts feature revenue attribution data tied to closed-lease contacts. Note: Views/submissions from excluded IPs/referrers aren't included.
- Page Views: Content loads on browsers.
- Form Submissions: Total form completions.
- New Contacts: New contact creations.
- New Customers: Initial converters are now customers.
- Average Bounce Rate: Starting sessions without further site movement.
- Time Per Page View: Avg. time spent per view, excluding exits.
- Exits Per Page View: Exit rate post-viewing.
- Entrances: Initial content in sessions.
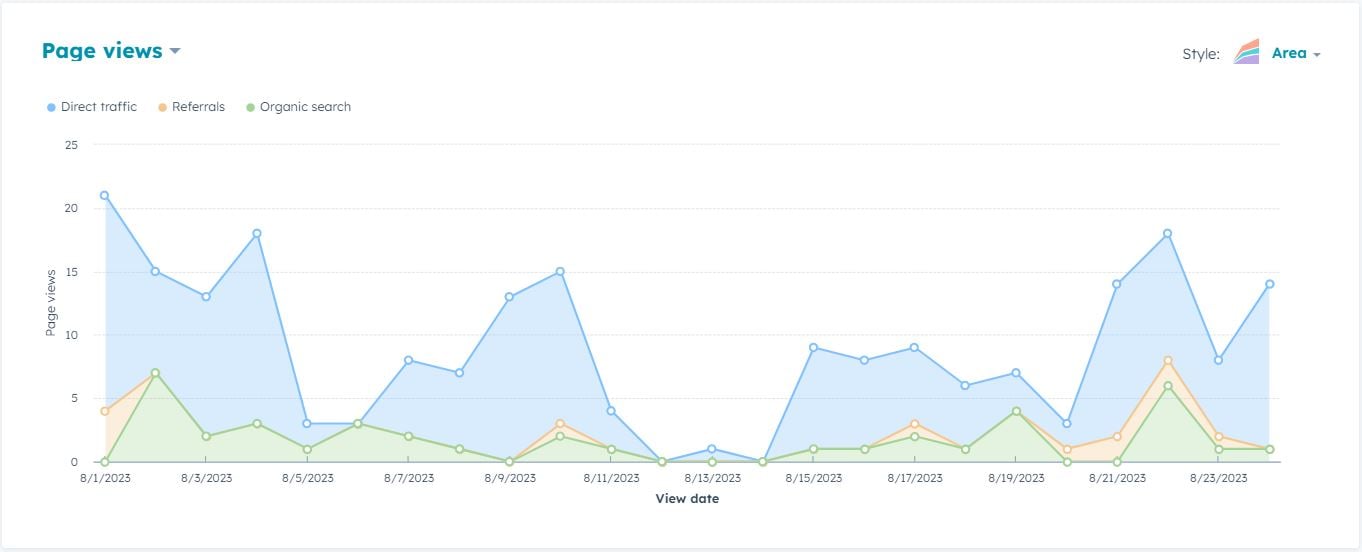
Beneath your metric summary lies a chart visualizing one metric over time, segmented by source. Sources are marked with color-coded bubbles; denoting session starts on your site or blog.
- Change Chart Metric: Alter the chart metric by clicking the top-left dropdown.
- Data Breakdown: Hover over chart points for specific stat breakdowns.
- Time Frame Adjustments: Change chart time frame via the top Frequency dropdown—choose Daily, Weekly, or Monthly.
Following the visual chart is a table displaying performance data for each source. Uncheck a source to exclude it from the chart. Click a source in the table to explore detailed source data.
Customizing Report Metrics:
- Click on "Edit columns" located at the table's top.
- In the ensuing dialog box, select the checkboxes beside the metrics you wish to incorporate. Keep in mind you can select up to seven metrics simultaneously.
- If you need to remove a metric from the "Selected Columns" section, click the "X" adjacent to its name.
- To adjust the arrangement of your chosen metrics, click on a metric and move it to the desired position.
- Once you're satisfied with your changes, finalize by clicking "Save".
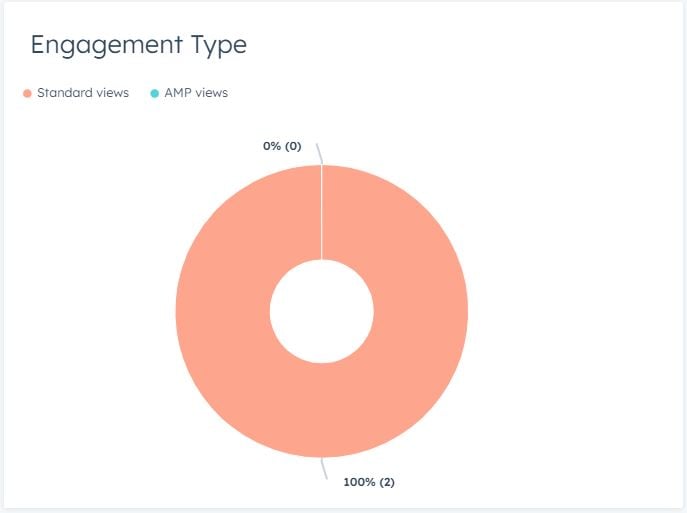
Engagement Category (specific to blog posts)
For instances where you've activated the AMP rendition of a blog post, this chart offers insights into the proportion of visitors who accessed the AMP version via mobile devices compared to those who engaged with the regular desktop version.
Video Analytics
You can access Video Views and Retention reports when Vidyard integration is active, and videos are part of your content. For A/B tested pages, select a variation from the Variation dropdown menu to view video data—note that video data cannot be aggregated across multiple variations.
Optimization
Discover suggestions to elevate your content's search engine performance in the Optimization tab. With Google Search Console integration, gain deeper insights into how your page fares for specific search terms.
Discover further insights on viewing SEO recommendations for your HubSpot content.
Smart Content Analytics
For accounts with smart content access, the Smart Content tab reveals analytics comparing smart content to default content. Only pages or posts with published smart content will show this tab.
Note: Global smart content lacks reporting.
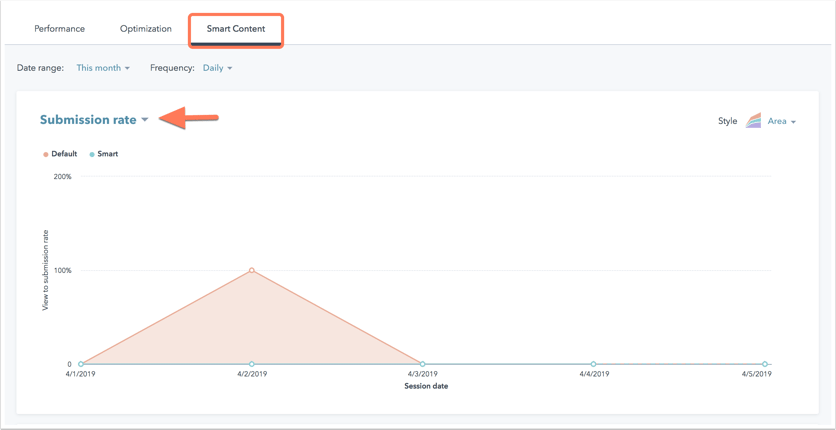
Smart Content
- Access the Smart Content tab for a performance breakdown.
- Adjust report timeframe via Frequency dropdown (Daily, Weekly, Monthly).
- Change metrics in the report using the upper left dropdown.
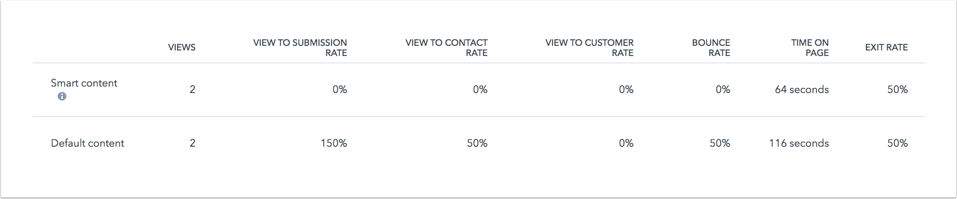
Following the chart, you'll find a breakdown detailing visitor engagement with your content, categorized by the presence or absence of a smart content rule. This breakdown excludes source data.


.jpg?width=352&name=_Choose%20the%20Best%20HubSpot%20Consulting%20Services%20(1).jpg)